September 2026
Making Data Useful
Making Data Useful
Howdy folks, and thanks for following along. I'm a scientist, so naturally I love data. If you've read these notes or my LinkedIn posts, you know I've talked a lot about data during the first few months of building HurriLab.
That groundwork is done for now. The global HurriLab forecast system is now running autonomously, and it's time to connect all that data to real operational questions.
All global HurriLab forecasts, accumulated over the last month or so:
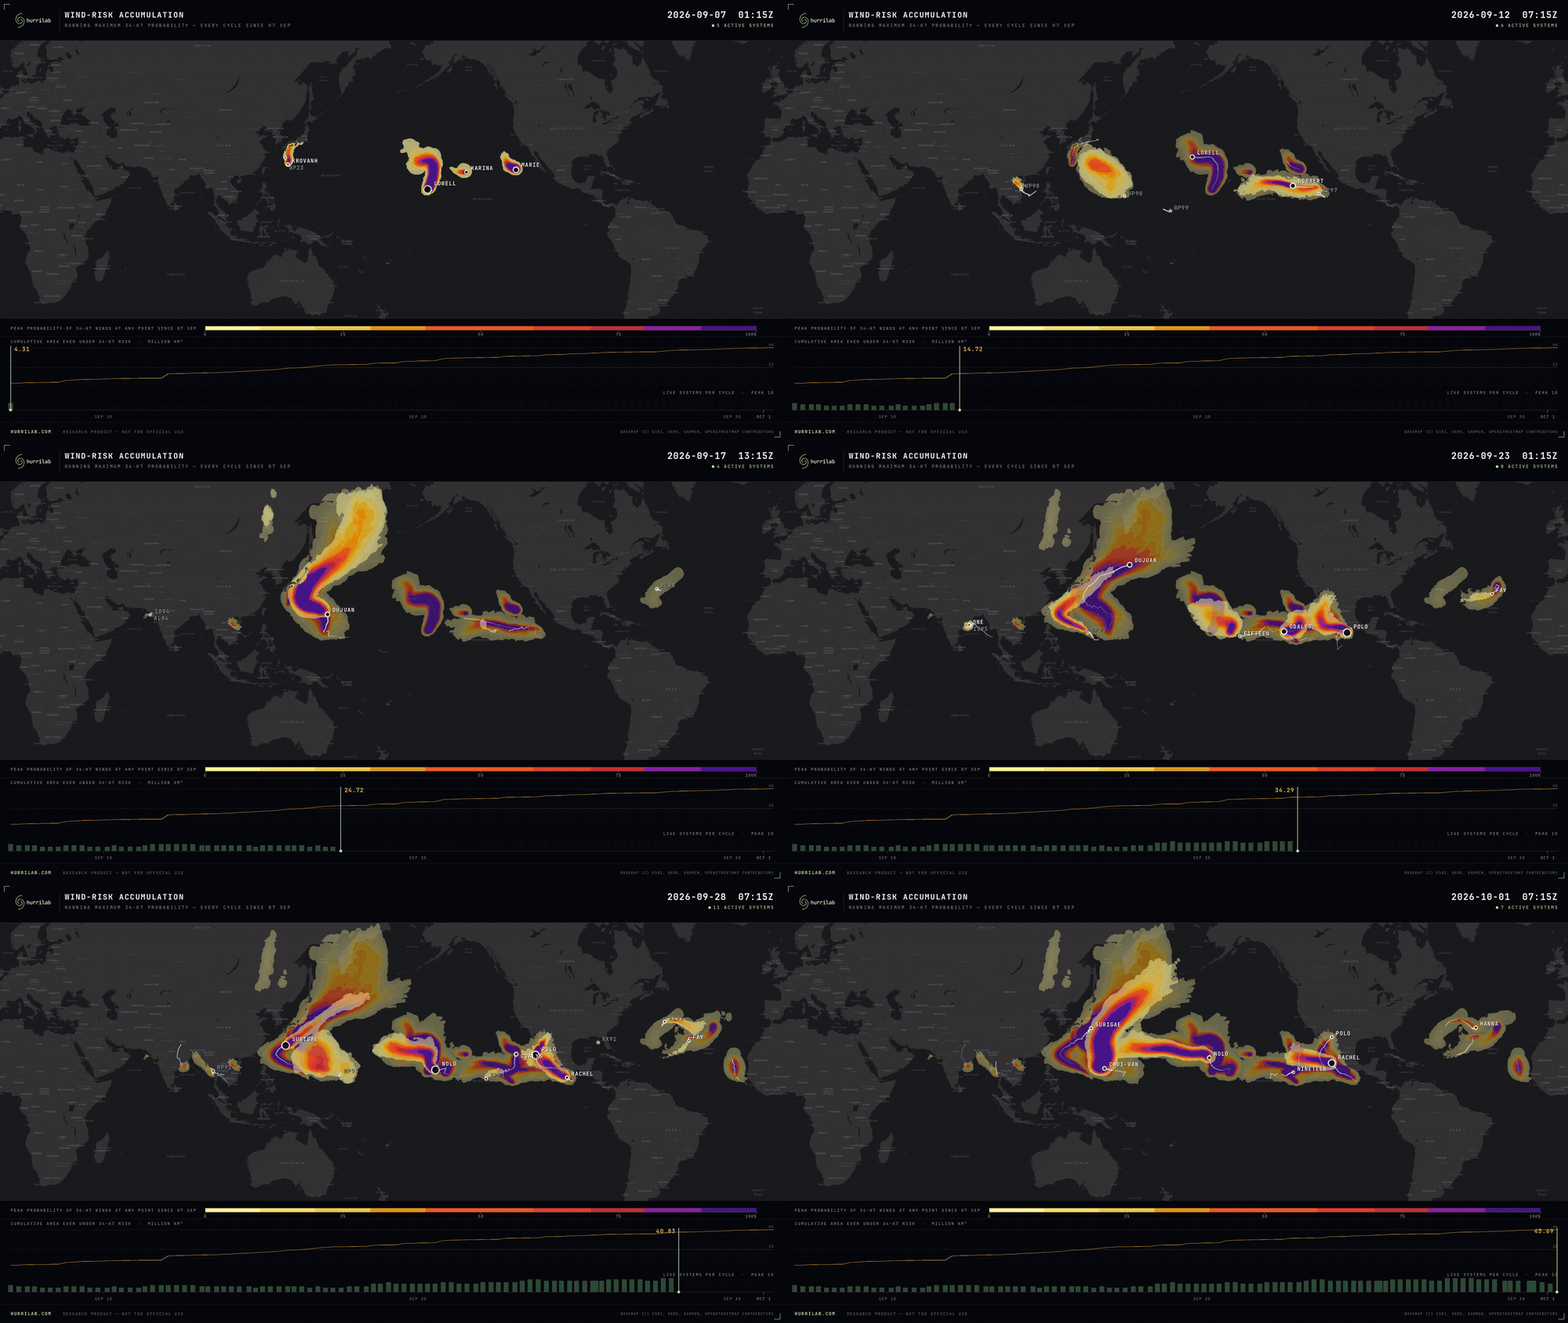
The data shown above is a tool, not an answer. It's not what most people have time to sift through when a storm is approaching, and very few real-time operational questions require every data point on earth.
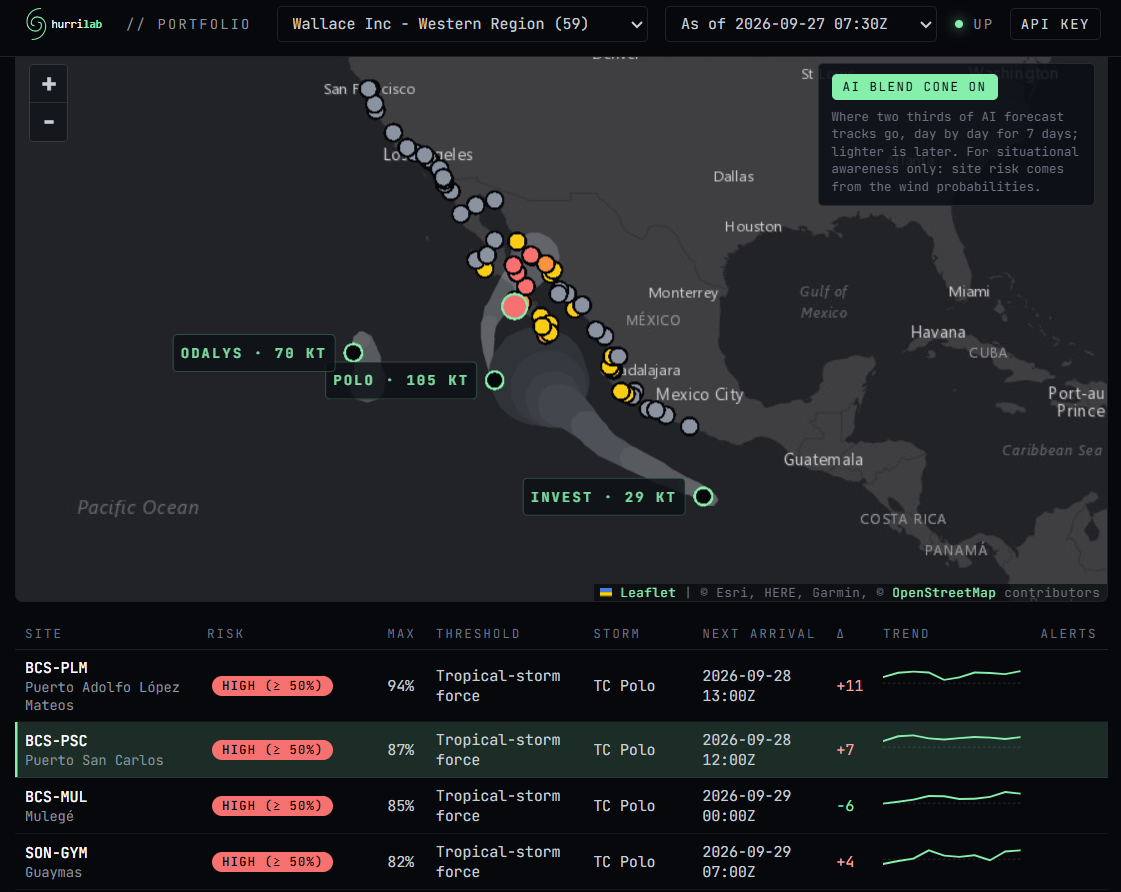
Do you remember Wallace Inc, the synthetic global corporation from last month's "agentic risk communication" example? On Sept 27, as Hurricane Polo approached Baja California Sur in Mexico, we shared a dashboard with Wallace Inc's Western Region Operations Manager – the person who decides when locations close or adjust operations ahead of hurricane impacts.
Here's what they saw on Sunday morning:
Wallace Inc Western Region dashboard, Sept 27:
the ops manager's questions → the dashboard's answers
Which of our locations are at risk?
22 of 59 Western Region sites, which span from San Francisco to Mexico City, show some risk in the next week from both Polo and another developing system. The highest-risk locations: PLM, PSC, MUL, and GYM.
How's the risk changing?
Risk at PSC has increased since last night, from 80% to 87% at the 34-knot wind threshold.
When will the wind impacts begin?
At PSC, expect the winds to arrive early Monday morning. Wind departure times are available for all sites and thresholds.
The focus of the dashboard is Wallace Inc's sites, not the storm. Storm "cones" can be toggled on for situational awareness, but the infrastructure stays front and center – and only the sites with real risk light up, with details for the ones that matter most.
Hurricane Polo made landfall in Mexico near Las Barrancas, about 80 miles north of PSC. Not a lot of data is readily available near the landfall location, but overall the storm was well forecast.
What's next?
This dashboard is just one way to use HurriLab. Over the coming months, I'll package the same global forecast system into a small set of products, each built around questions I've heard from operations teams. Next month, I'll update hurrilab.com to lay those out, along with details on how they're delivered.
You don't have to wait, though. The system is running now. Book 20 minutes, tell me which sites and questions matter most to you, and you can be testing your own dashboard before this season ends, or get set up and ready for the next season.
Simple, built on HurriLab's global forecasts, and customized for your operational footprint.
—Wallace
Book a meeting · HurriLab.com
Graphics shown are experimental prototypes produced by HurriLab LLC, derived in part from ECMWF open data (© ECMWF, licensed under CC BY 4.0), NOAA/NWS data, and Google DeepMind WeatherNext data accessed via Weather Lab. Source data has been modified by HurriLab LLC. HurriLab LLC is not affiliated with, sponsored by, or endorsed by Google, ECMWF, NOAA, or any government meteorological agency. © 2024-5 Google LLC, whose machine learning models were used to create the experimental data made available under the following licence terms https://storage.googleapis.com/weathernext-public/terms-of-use.pdf. This data is intended for experimental modelling only and is not intended, validated, or approved for real world use.